

If you are experiencing a weird issue or bug, please message us using our Contact Form.
Here is some information that would be VERY helpful to us in order to help you…
 What browser version are you using?

 Optional: Provide Screen Recording
Screenshots and video really help us to understand user behavior and UI oddities.
- Mac:
Command + Shift + 5opens the native screen recording tool. Learn More

- Chrome users: Can install free extensions like Loom

Chrome: How to Report Console Errors
Sometimes screenshots aren’t enough and we need to see under the hood a bit…
Steps for End-Users:
- Right-click anywhere on the page > Click Inspect
- Click the Console tab
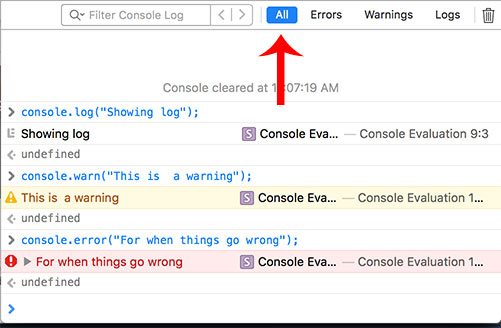
- Look for any errors (in red)
- Right-click in the Console > Save as… to download a
.logfile
(or take a screenshot if easier) - Paste the first few lines of the error if they can copy it directly.


Alternatively, you also click the Network tab to check if any API calls are failing (red entries).
- Go to the Network tab.
- Repeat steps which led to error
- Look for failed requests (usually highlighted red).
- Click one to see:
- Request details
- Response payload
- HTTP status codes (like 404, 500)
- Click on Preview tab on the right to see the text of error
 Safari: How to Report Console Errors
Safari hides developer tools by default. Here’s how to access them:
One-Time Setup:
- Open Safari
- Go to Safari > Preferences > Advanced
- Check:
 “Show Develop menu in menu bar”
Steps for End-Users:
- Go to the broken page
- Click Develop > Show JavaScript Console
- Copy or screenshot any red errors